Shropshire Council went ahead and cancelled the rural Link service today. The buses are still running, but only for schools. Disabled and elderly people will need to use dial-a-ride community transport, which will run shorter distances, less frequently. Hereabouts, that’s the Ludlow Traveller service.
There was never any need to scrap Link. It was costly but it did not need to be so. Bizarrely buses were based in Shrewsbury, even if they only ever ran 30 miles away in the south of the county.
Passenger numbers grew substantially from Link’s launch in December 2008 to a peak of around 3,000 passengers a month in mid-2012. From end of 2012, they have declined, though now seem to seem to be fairly static at around 2,500 a month. This compares to an average of 1,005 passengers a month on the previous fixed rural services. Nearly 3,000 school students use the service each month.
Though service use grew overall until the end of 2012, the different zones fared differently. Details are given in the graphs below (click on a graph for a bigger image).
The puzzle is why numbers dropped after the end of 2012. Is it a coincidence that the drop begins at the point that Shropshire Council announced that the service was under review? Callers to BBC Radio Shropshire told presenters that they found it difficult to get through and make bookings in recent months. The service seems to have become less accessible.
But it certainly could have been rescued. It just needed managing properly. Some services need to run less often. Some routes needed changing. Publicity needed to be ramped up. That’s what any service manager would do but not in Shropshire Council. They don’t manage transport.
The broader truth is that Shropshire Council’s decision to scrap link is driven by dogma. Its Conservative leadership is unhappy with running anything. At times they seem allergic to the public sector they were elected to manage. They have to cut budgets, but they don’t need to pursue their current slash and burn policy. They don’t need to hit the elderly, vulnerable and disabled in the way they are doing. They just need to manage the service.
_______________
Link numbers grew substantially from its launch in December 2008 to a peak of around 3,000 passengers a month in mid-2012. From end of 2012, they have declined, though now seem to seem to be fairly static at around 2,500 a month. This compares to an average of 1,005 passengers a month on the previous fixed rural services. Nearly 3,000 school students use the service each month.
On a yearly basis, passenger numbers have grown, peaking in 2012 and falling back in 2013.
|
2009 |
2010 |
2011 |
2012 |
2013 |
|
| Total |
21,629 |
27,298 |
32,292 |
34,559 |
17,930 |
| Monthly average |
1,802 |
2,275 |
2,691 |
2,880 |
2,561 |
Monthly averages for 2013 look fairly stable, bearing in mind the variation in monthly use (see below).
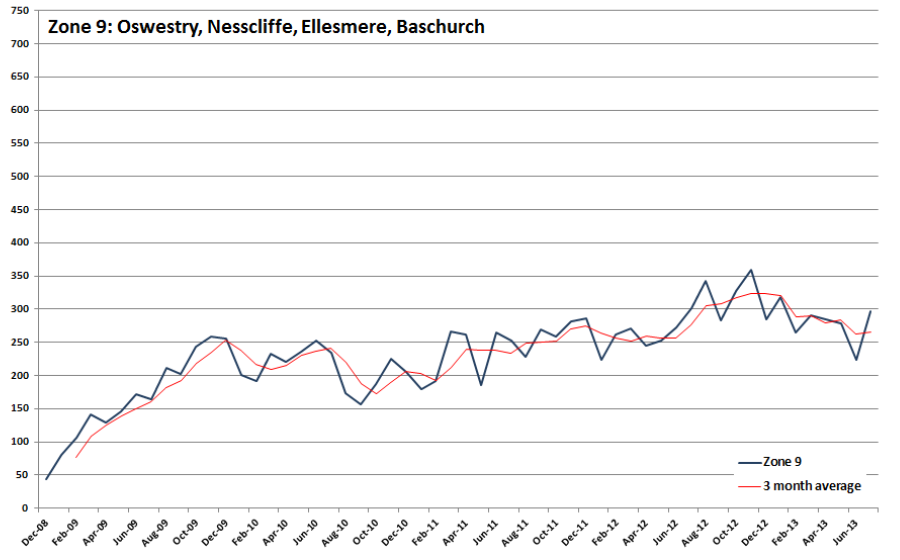
The fall in numbers between 2012 and 2013 is seen in all Zones except 3 & 7. Zone 3 has maintained level passenger numbers since mid-2010 and Zone 7 has increased steadily since it was launched. All zones show an increase in July 2013, ranging from 6% to 50% but this is within the normal level of monthly variation.
This is the overall trend, which is overlain by considerable month by month variation in numbers.
The monthly change in use is high, with overall numbers plummeting by -19% and soaring by +25% from month to month (individual zones are more variable). Generally speaking, passenger numbers go up or down together across the majority of the zones. This suggests that it is not local factors causing the variation, but county wide factors.
Technical notes
Data. The data run from December 2008 to July 2013.
Schools. This analysis excludes school passengers. These are given as a unvarying 2,945 a month, from which it is clear that Shropshire Council does not monitor the numbers actually using the service. Indeed, given that the number has been estimated as static from December 2008 to July 2013, it suggests they do not know the actual numbers and the 2,945 is merely the number used for accounting purposes.
Variability. Monthly variation ranges between -19% and +25% from month to month. The average monthly variation is 8%. I have no comparative data, so it is difficult to tell whether this is a normal level of variability. But given that Link tends to take the same people month to month, I’m puzzled by the variation. This means that it is dangerous, even disingenuous, to compare between two dates. For example, deputy transport portfolio holder Peter Adams was dragged onto Radio Shropshire to defend the cuts. When challenged about rising bus numbers he said: “The main one that’s increased, the main one that’s used is Zone 2, it’s increased by one. One.” He told me later “The figures that I used were from march 2012 and march 2013, a reasonable comparison figure.” That’s a 13-month period, so it is not of course a usual comparison figure, or even a reasonable one.
It is not possible to identify with any certainty what factors affect monthly variation.