
It was a private meeting so I can’t name the Tory councillor that asked: “Surely there are no poor people in Ludlow?” I suspect that she had never been beyond Mill Street [1]. Those of us that know this town intimately recognise that affluent people live cheek by jowl with people who struggle to make ends meet. That’s part of the character of the town. It’s a place where we have the wealth to keep our historic buildings in good order but also need to run a food bank. The seventh most deprived area in Shropshire is here in Ludlow, but other areas are rated as among the least deprived anywhere in England.
Poor people? What does that mean? Low income, unemployment and bad housing are all factors in being poor – together they create a state of deprivation. Add to these education and skills, health and disability, crime and living environment. Then you get the Index of Multiple Deprivation (IMD). It’s the standard measure used to identify neighbourhoods that are struggling (and those that are booming).
Deprivation in Ludlow varies street by street, even within streets. We can’t get data for the IMD at street level, so we have to use rather broad areas (LSOAs). There are seven of these areas covering Ludlow town and some of the surrounding countryside (see map below). They are far from a perfect basis for looking at deprivation, but they do show how varied our town is.
Look at the graph below and you’ll see the point I want to make in this blog. On the left are the most deprived areas in Shropshire. The Harlescott area in Shrewsbury is the most deprived patch in our county. It stands alongside Meole Brace, Moneybrook, Monkmoor and Ditherington, again all in Shrewsbury. The north part of Market Drayton and the centre of Oswestry join them in being the most deprived areas of Shropshire.
 Then comes Ludlow’s Sandpits, the seventh most deprived area in the county and among the 20% most deprived areas of England. At the other end of the graph, we have the Fishmores, the Stantons and the Bringewoods, which are in the 20% least deprived neighbourhoods. Doing even better is an area that stretches from Rocks Green to Whitcliffe, taking in Ludford village and much of the housing off Parys Road. This shows one of the limitations of this analysis. Rocks Green is not affluent. It should never be lumped in with Ludford.
As limited as this analysis is, it does kill the lie that there are “no poor people” in Ludlow. It does show how varied our town is. It does show that people here struggle as well as thrive.
If we have good data, perhaps we might make good policy? Or is that too much much to hope for?
The Technical Stuff
The seven domains for the Index of Multiple Deprivation are: income; employment; health deprivation and disability; education, skills and training; barriers to housing and services; crime; and living environment.
Here are the LSOAs for Ludlow. They are defined by the Office of National Statistics. The area labels are my own.
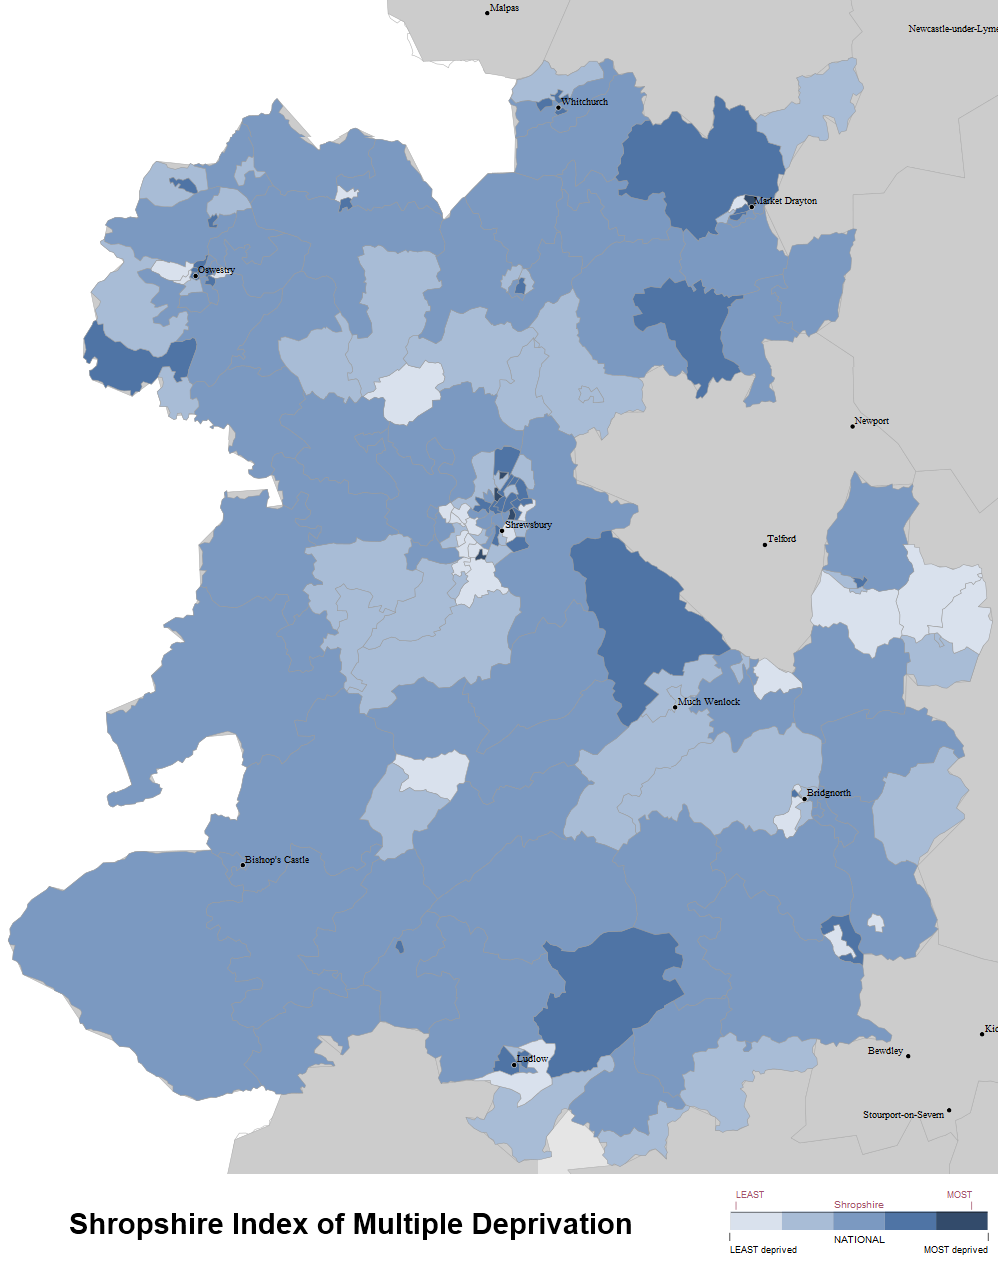
 And here is a map of the Index of Multiple Deprivation in Shropshire. The darker the blue, the more deprived the areas are.
 Notes
Notes

[1] I should make it clear I am not referring to former councillor Rosanna Taylor-Smith in this comment, but a councillor elsewhere in the county.