
A year or so before I moved to Shropshire, I drove from Oxfordshire to visit the biodigester on Coder Road. The plant was a work of wonder, new technology that turned food and farm waste into compost, generating gas and electricity in the process. The biodigester has since been shut down but anaerobic digestion has remained a significant green industry around Ludlow. The last I heard, the biodigester industry employed nearly 150 people in the Ludlow area.
It is not surprise therefore to learn that by March last year, Shropshire topped the league table of local authority areas with capacity to generate electricity from anaerobic digestion. It was also ranked third for producing heat from biomass. For all forms of renewable energy, Shropshire was ranked ninth out of the 348 local authorities in England and Wales.[1] That’s not a bad track record.
This data comes from a new website launched by the Green Alliance, a confederation of green groups. The Renewable Energy Locator gives a fascinating insight into progress on renewable energy provision across England and Wales.
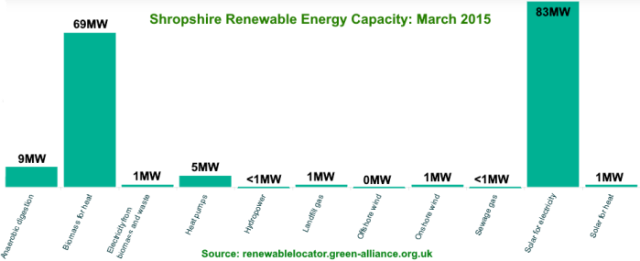
Shropshire has an installed capacity of 176 MW of renewable power. Herefordshire only has 112 MW capacity, though Powys beats us both at 229MW.
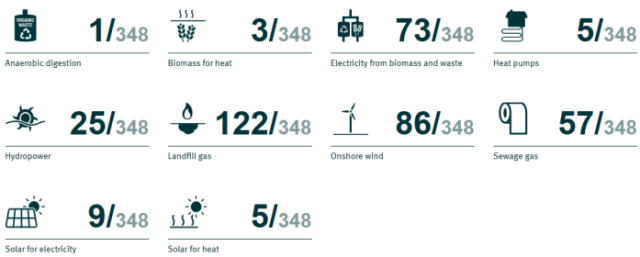 Renewable energy ranking for Shropshire compared to other local authorities
The picture is not as rosy when we compare the amount of electricity we generate from renewable energy with the amount of electricity we consume. Just 10% of the electricity we use comes from renewable energy we generate within our county’s borders.[2] That ranks us at position 108 out of the 348 local authorities.
Shropshire is well behind Selby, which generates a stunning 1,477% of the electricity it uses from renewables. But we are doing better than Hereford, which generates just 5%. Over the border in Powys, there has been huge opposition to the march of wind farms across its hills. But the county still only generates 56% of the electricity it consumes from renewables.
In Shropshire, most of our renewable energy comes from biomass for heat and solar for energy. Wind energy barely gets a look in.[3]

Shropshire comes ninth in the league table of renewable energy and first in anaerobic digestion. We are not top of the class but we have huge constraints in this county, not least the Shropshire Hills area of outstanding natural beauty, which covers 23% of our land area.
Looking at this renewable energy data, the real story is that we only provide 10% of our electricity needs. To improve this, our priority should be to use less power. We shouldn’t be generating electricity just for it to be wasted in badly insulated buildings. That means ensuring that new buildings must be built to zero-carbon standards. Existing buildings must be insulated as a matter of urgency.
 Thermal heat map and energy efficiency in the Shirehall area
(This data is not available for Ludlow)
Notes
[1]. This sort of ranking exercise always has its limitations. County and local authority districts vary greatly in the area they cover. Urban districts will usually have less capacity for generating renewable power than rural districts. I have chosen to compare at local authority level because data at traditional county level combines Shropshire with Telford and Wrekin. Telford is largely urban – just 14% of its population lives in rural areas compared to 75% in Shropshire. It is a on a different trajectory to us. Telford is ranked 121st out of the 348 local authorities for renewable energy production, with capacity of 37MW. Shropshire including Telford and Wrekin is ranked 27th out of the 56 traditional counties.
[2]. In practice, nearly all the electricity we generate is pooled in the national grid and not used locally.
[3]. It may seem counterintuitive that Shropshire is ranked 86th out of 348 local authorities for wind energy yet has a capacity of just 1MW. However, 181 of 327 English are almost entirely urban, so have close to zero wind energy capacity. (I don’t have a rural/urban classification data for Wales.)