
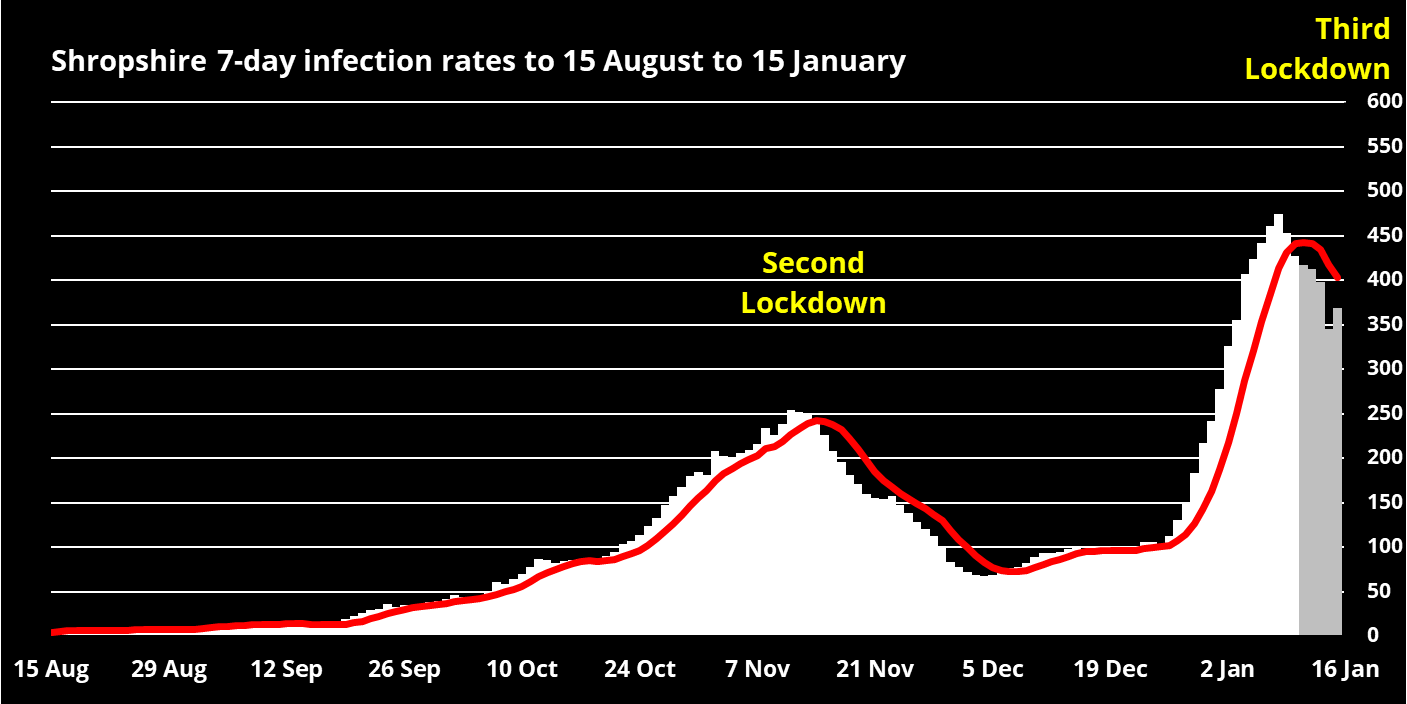
Good news at last. Covid-19 infection rates are falling in Shropshire and Telford & Wrekin, also across England. It looks like the peak caused by the new variant and relaxing of social mixing, within the rules and in breach of the rules, has ended and rates are beginning to fall rapidly. Although the fall has been in the last week and the data are provisional, the trend is looking good.
There are quite different experiences across Shropshire. The east and north side of the county has the highest rates of infection, the south west, including Ludlow, the lowest.
The graphs above and at the end of this article show a clear dip in the daily count of new cases. It is too soon for the vaccination rollout to have a noticeably big impact on infection rates. The reducing rates seem to show that the third lockdown is working.
The most recent data for Ludlow are for the seven days to last Sunday, 10 January. They showed a seven day infection rate of 100 per 100,000 people. That was less than a tenth of the infection rate in the Albrighton, Cosford and Shifnal area – 1,048. In Shrewsbury, the rate was even higher at 1,057.
For the purposes of the analysis for this article, I have divided the county into six areas and calculated the infection rate for each of area to show how different experiences are around the county.


Notes
Some words of caution on this data.
The daily counts for the last five days to 15 January are provisional. They will be revised over the next week but there is no reason at present to believe these routine revisions will change the overall trend.
The local Shropshire and Telford & Wrekin data is corrected data up to 10 January 2020, the end of Week 1.
Thanks Andy, for all your detailed hard work, much appreciated.