
We are getting there but Shropshire infection rates not falling as fast as the rest of the country. Infection rates plateaued in late January and early February. This might be a product of the testing regime but overall the trend is in the right direction. Downwards. The same is true of Telford & Wrekin where infection rates are falling steeply through around two weeks behind the national picture.
As vaccination rollout continues to accelerate, it can only get better.

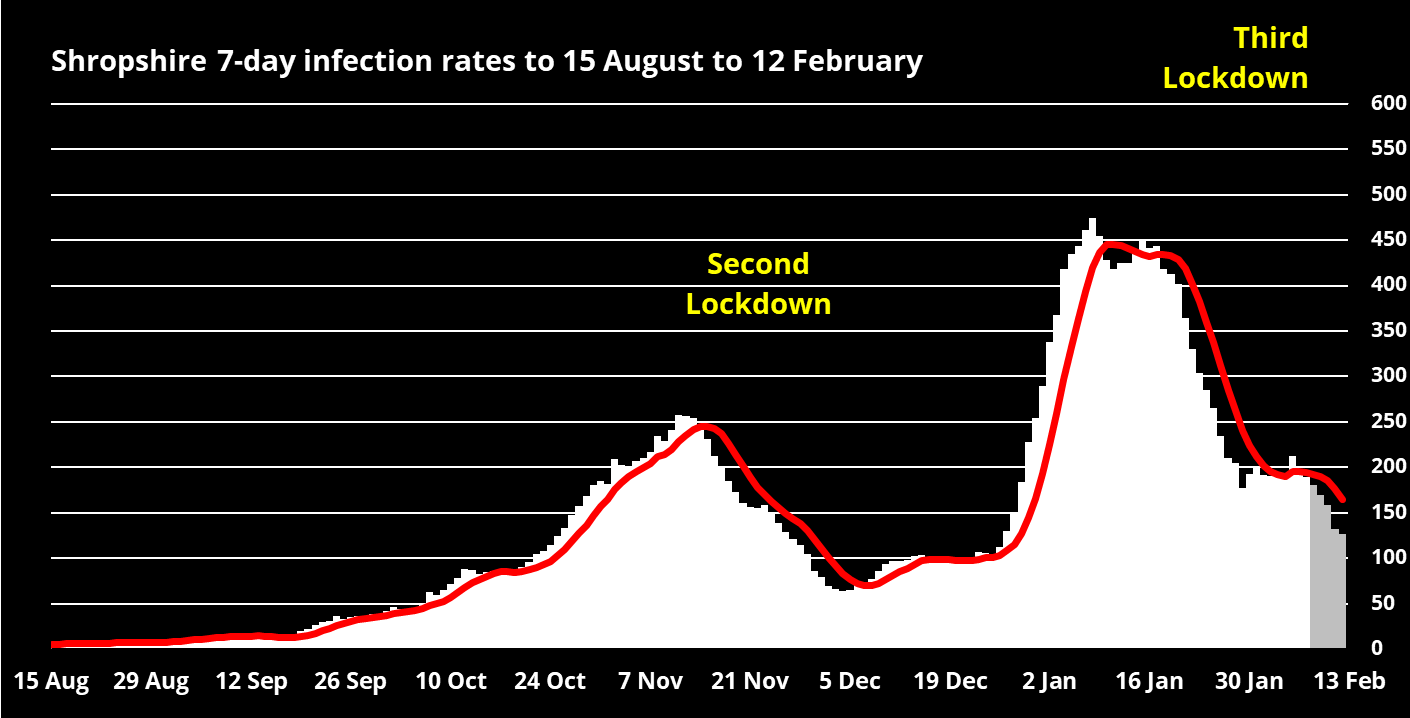
The graph above shows comparative trends since the start of the second wave.
Infection rates across England are falling more steeply than locally.
Telford rates have always been higher that Shropshire. In November, there was a significant outbreak at Harper Adams University. In recent weeks, the spread of infection may be through the workplace, Telford having more industrial workplaces that Shropshire. As a result, there are probably a lower proportion of people working from home.

In Shropshire, infection rates plateaued between 25 January and 5 February, stubbornly refusing to fall. Now there is a sign they are on the way down again. But this is provisional data and may be corrected over the next week. The number of tests in Shropshire plateaued at the same time following a call from Shropshire council for people with a wider range of symptoms. The per cent of tests that have proved positive has fallen. That could just be due a people with lesser symptoms coming forward for testing but let’s hope that it is sign a deceasing infection within our community.

Infection rates are falling cross the county. They remain low in the south west Shropshire though there has been a small outbreak in care setting in the Bishop’s Castle area. The most recent data show a seven day infection rate of 100 per 100,000 for Ludlow and 646 for Shrewsbury.


