
One of the most common questions I have been asked of late is how bad has Covid-19 been in Ludlow? How many people have died if it?
For Ludlow, Covid-19 was cited eight times on death certificates over the four months to the end of June. There were four recorded Covid-19 related deaths in Ludlow in each of April and May, and none recorded in June. Shropshire, Telford and Wrekin and Herefordshire showed similar rates of citation of Covid-19 on death certificates. A record of Covid-19 on a death certificate does not mean the person died of it, only that they tested positive.
Despite the fall in cases and deaths in June, Shropshire is not out of the pandemic yet.
On Friday, three cases of Covid-19 were confirmed in a community in Craven Arms. As of Sunday, this has increased to 21 cases. Press release and details of the new testing centre in Craven Arms.

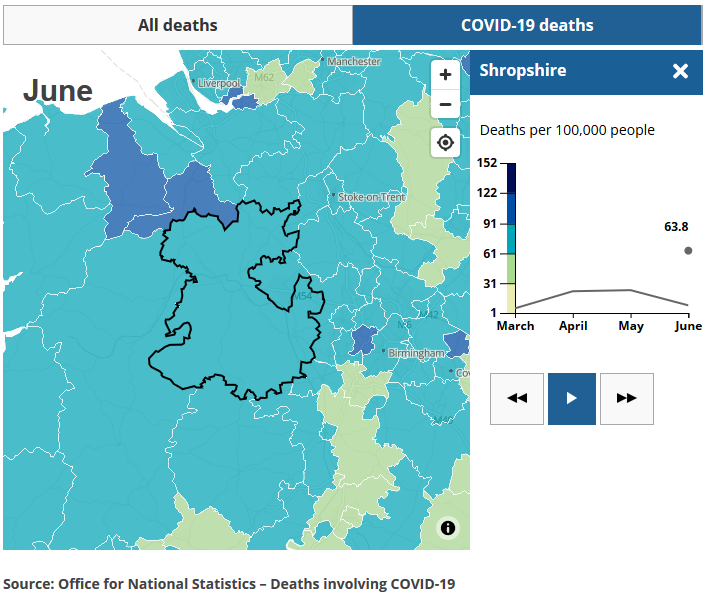
The eight deaths in Ludlow over four months equate to a rate of around 73 deaths per 100,000 people. In Shropshire as a whole, there were 64 deaths per 100,000 over the same period. The death rate was the same in Herefordshire and Powys. The rate was higher in Telford and Wrekin at 78. In Wolverhampton, the rate was 71. Across the West Midlands, the recorded Covid-19 related death rate was 100 per 100,000 people.


The data show that deaths are now falling
There is a major caveat attached to the Ludlow death rate. We are dealing with small number statistics. A change of one or two deaths in Ludlow would have a big impact on the death rate. Nevertheless, the Ludlow data do give a sense of perspective. Our death rate is around the same as surrounding rural areas and lower than more urban areas. That is as might be expected.
People also want to know how many people have caught Covid-19. This is a question that can’t be answered. All we can look at is test results.
There is no information for Ludlow but we do know how many people have tested positive in Shropshire. The chart below shows that there were 1,413 positive tests for Covid-19 up to 20 July. This is higher than the West Midlands as a whole. But it is probable that the difference tells us more about variations in the level of testing than the level of Covid-19 in the community.

National trends are available from the Financial Times. The government is also publishing trend data of cases.

Notes
Sources. The two sources for this article are the Office of National Statistics (public data) and LG Inform (available only to councils).
Area. In this article, Ludlow is defined as Shropshire 038 Middle layer Super Output Area (MSOA). This is a standard geospatial unit used to study local statistics. The map below shows that MSOA Shropshire 038 (pink) is a good fit to the town area and includes Ludford, Sheet and Rocks Green.

Deaths are those occurring between 1 April 2020 and 30 June 2020 and registered by 11 July 2020 where Coronavirus (COVID-19) was the underlying cause or was mentioned on the death certificate as a contributory factor. Figures exclude death of non-residents.