
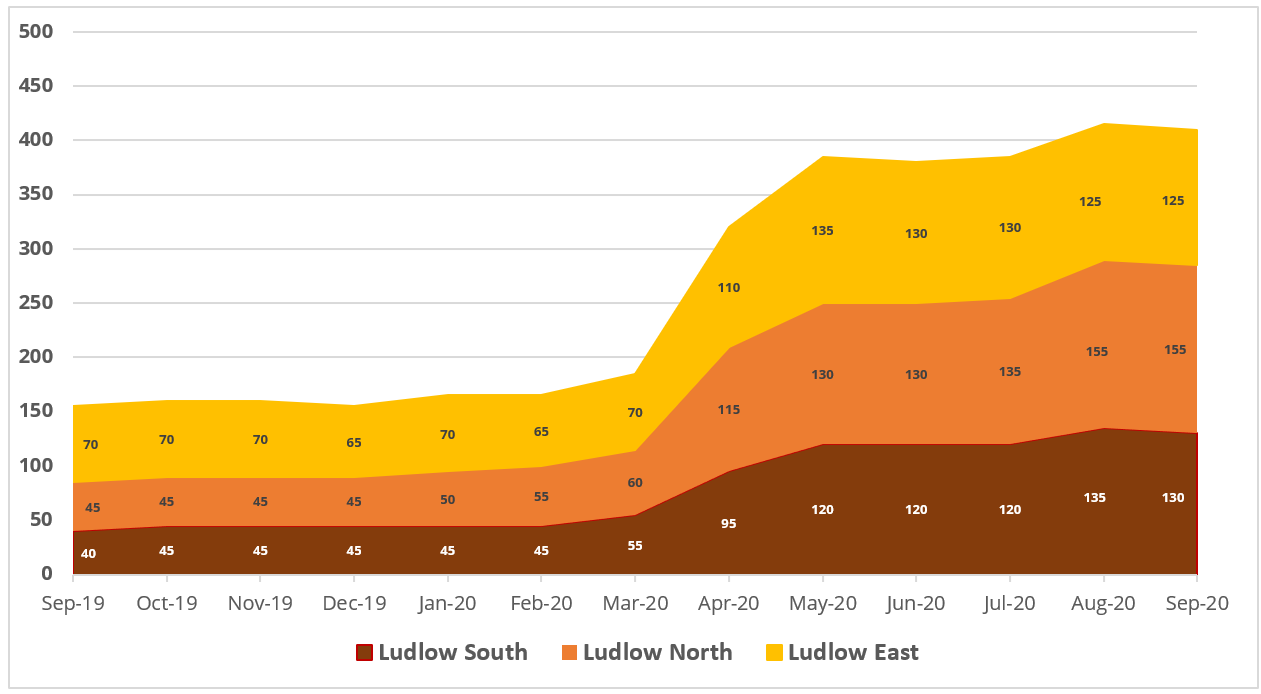
This is a good as it gets these days. Unemployment, as measured by claimants on Jobseekers and on Universal Credit who are seeking work, in Ludlow remained static between August and September. Our town had 410 claimants for Jobseekers or work related Universal Credit. The unemployment rate in Ludlow North, which includes the town centre remains stubbornly high at 8%. This probably a result of reduced employment in our pubs, bars and hotels.
This is the third of a monthly series on unemployment data. I don’t intend to depress or scare people with the numbers but we do need to understand what is happening in our community during after the exceptional events of 2020.

Unemployment in Ludlow is around 6% of the workforce, that’s around the average across England, Scotland and Wales. Ludlow North, which includes all the town centre and stretches out to Bromfield, is rather higher than the average at 8%. This is likely to be a result of reduced job opportunities in the hospitality sector. Our town centre is world famous for comfortable eating, drinking and sleeping and the pubs, restaurants and hotels provide a lot of jobs.
The current statistics only take us to mid-September. There seems little doubt that the Eat Help to Help Out scheme during August helped to prop up short-term and part-time employment in the leisure and hospitality sector. Next month’s figures, due on 11 November, will give cover late September and early October and will give a clearer picture of the trend in unemployment.
There are fears that the number of people looking for work will rise when the furlough scheme ends at the end of this month. If Shropshire moves to Tier 2 Covid-19 restrictions, that could again have an impact on the hospitality sector.
No one can predict what will happen in the coming months. We can help preserve jobs and help stop the spread of Covid-19 by staying local, shopping local and, of course, eating and drinking local.
Notes
In this article, Ludlow is the three wards of Ludlow East, Ludlow North and Ludlow South. The North and south wards include some of Ludlow’s rural hinterland.
Data are from NOMIS and the House of Commons Library.
Jobless figures, which many of us think of as the sum of the dole queues of old, are not straightforward to interpret. The replacement of Jobseekers Allowance by Universal Credit increased the numbers of those counted as looking for work. This seems to have added around ten to eleven per cent to the count locally over the last few years.
This figure does not show a much larger number of unemployed self employed people who cannot claim benefits because they live with someone still working. Covid has created huge numbers of out of work self employed from the creative and music sector and many other related industries who live in this area.