We have seriously good news. At last the economy, after the biggest crisis of my lifetime, is working not hurting – well, not hurting as much. And, despite what many people think, there are jobs for the young.
In the last two years, unemployment in the Ludlow constituency [1] has fallen by nearly half. In August 2012 there were 1,042 Jobseekers claimants. This June, there were just 553 claimants [2].
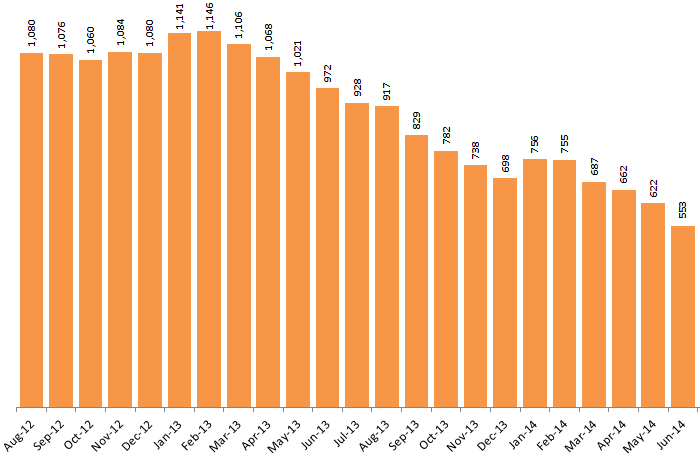 Data from the Office of National Statistics
There are seasonal changes in jobs. Unemployment rises by 4 or 5% in the first two months of the year, no doubt as hospitality staff are reduced post-Christmas and they have to sign on. This year, around 30-40 extra people signed on across the constituency as the New Year began.
I have lost count of the number of times people have told me: “There are no jobs for the young in Ludlow.” There is a major problem that many youngsters move away because we lack jobs for well-qualified young people. But unemployment levels amongst the young that remain in South Shropshire are not as high as many people would expect, and they are falling.
Unemployment is falling fastest amongst young people, those aged 16-24. In June 2012, young people made up 21% of the unemployed in Ludlow constituency. By this June this had fallen to 17%. Only around 125 young people are unemployed across the constituency compared to 270 a year earlier. Not all young people are signing on but I think most people would estimate the number of young Jobseekers would currently be higher than 125.
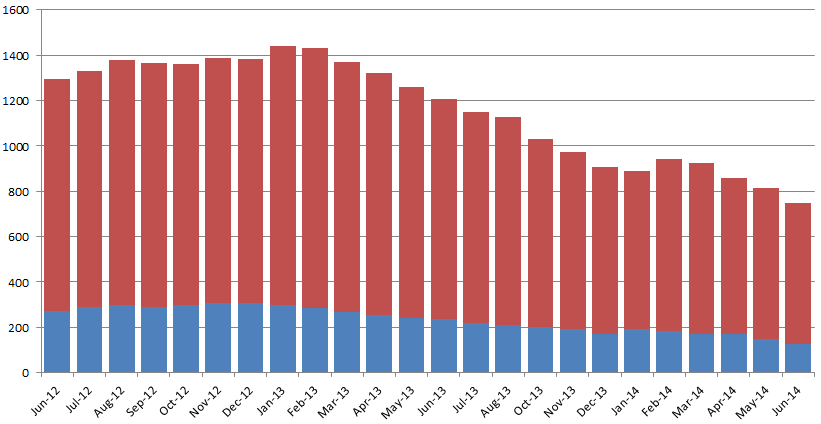 Data from the Office of National Statistics and NOMIS. Young people (16-24) blue.
How does our unemployment compare with that of the rest of the UK? It’s less than half, with a 1.4% unemployment rate in in Ludlow June this year, the same as North Herefordshire. This is significantly lower than 3.3% nationally, 2.2% in Shrewsbury and Atcham and 2.5% in North Shropshire.
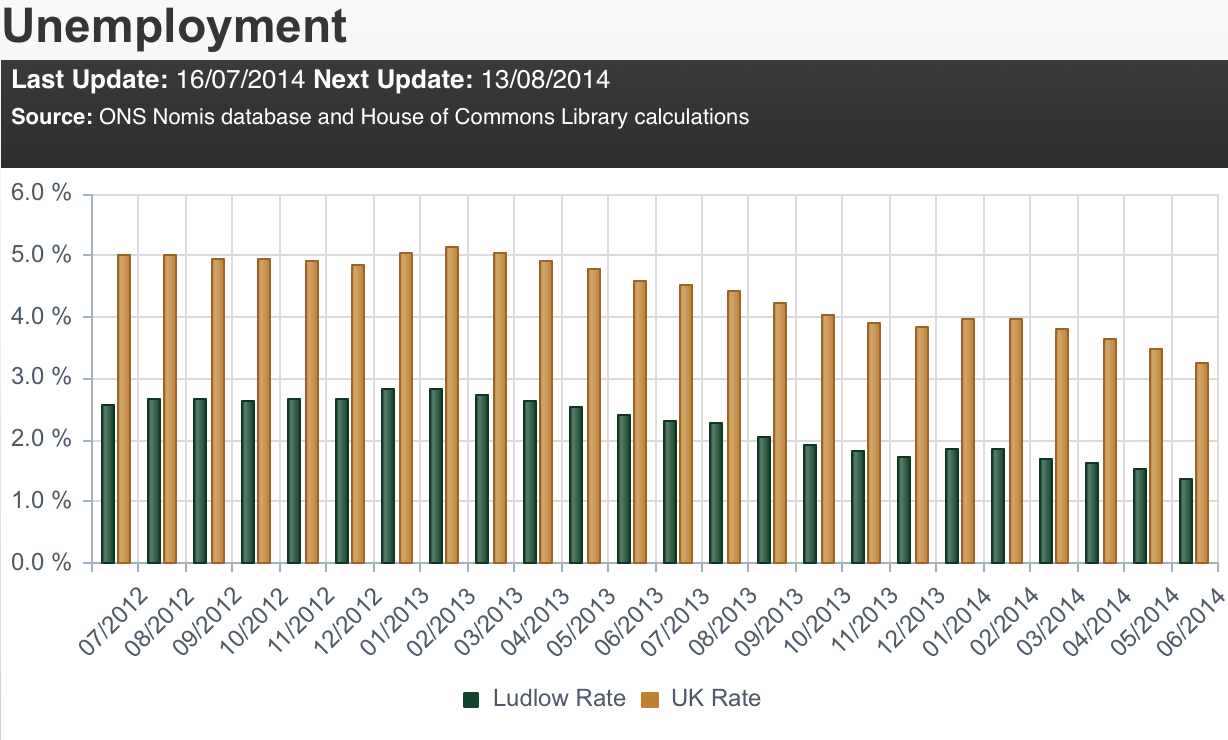
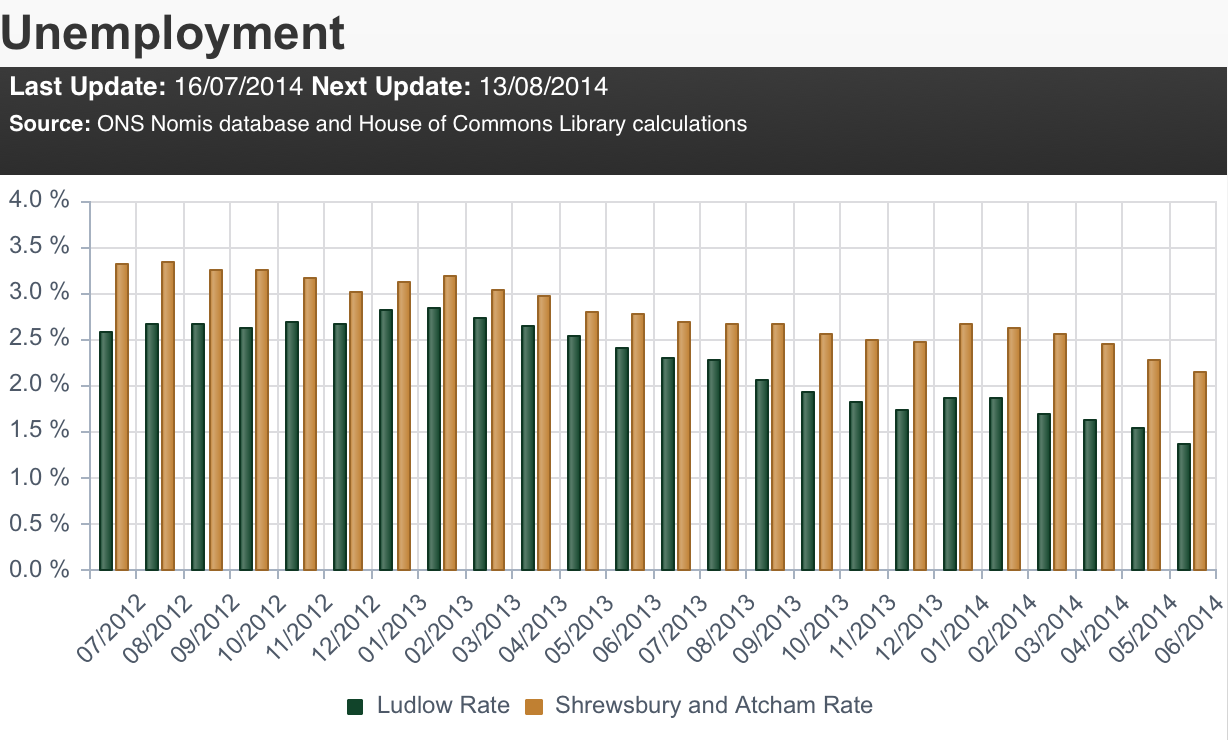 Images from House of Commons Library myConstituency ap
Among young people, we have 2.3% unemployment, lower than the national average of 4.0%, the Shrewsbury and Atcham rate of 3.1% and the North Shropshire rate of 4.3%. Again we are similar to North Herefordshire, which has a youth unemployment rate of 2.6%.

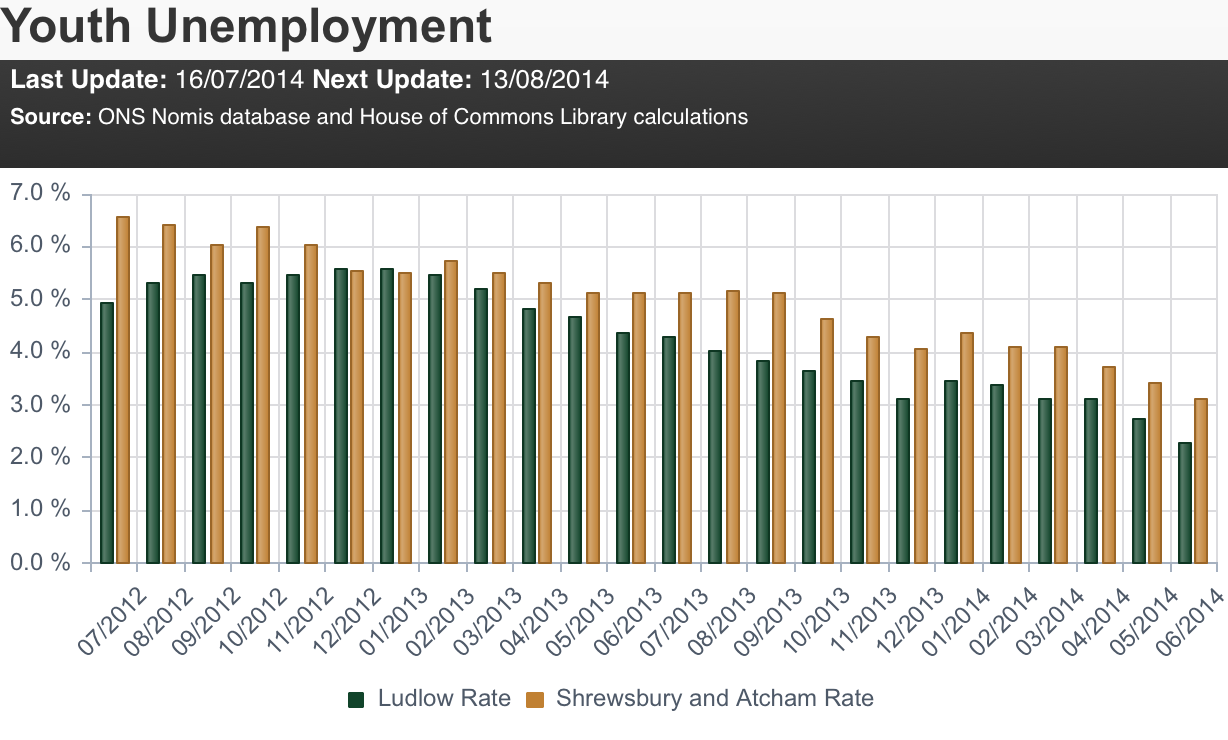 Image from House of Commons Library myConstituency ap
Finally, how are we doing on wages? We won’t get up-to-date data until the end of the year. Provisional data for 2013 suggests that wages in Ludlow constituency went up 14.3% on the previous year [3]. That’s an astonishing leap given the national increase was just 2.6%. North Herefordshire saw a drop in wages of 1.2%. But wages in Ludlow remain persistently low, £23 a week lower than Shrewsbury and Atcham and £89 below the national average.
|
|
Median weekly wage |
Annual |
| UK |
416.5 |
2.6 |
| Ludlow |
327.6 |
14.3 |
| Shrewsbury & Atcham |
350.2 |
5.5 |
| North Shropshire |
361.3 |
4.5 |
| North Herefordshire |
314.8 |
-1.2 |
We are getting good news about employment at the moment but there is never any room for complacency. There are people unemployed who need jobs. A lot of our jobs are low paid. But we should at least cheer that employment prospects have improved significantly in the last twelve months.
[1] The Ludlow constituency stretches from Chirbury and Bishop’s Castle to Bridgnorth and Claverley and Much Wenlock to Ludlow. Some areas will undoubtedly being experiencing better employment conditions than others at the moment.
[2] The Jobseekers statistic (JSA02) is a partial measure of unemployment. The International Labour Organisation (ILO) definition typically gives higher rates because it includes those out of work who are not claimants. Despite JSA02 underestimating unemployment, that does stop it being useful for looking at trends in unemployment or for comparing areas. As this paper from Gateshead council explains, the Jobseekers measure is precise but the EU surveys that use the ILO measure are too imprecise to be useful below regional level. Economics Online also gives a useful briefing on the nature of unemployment data.
[3] Here I am citing the median weekly wage, which is a better reflection of average wages than the mean. It covers employees, not the self-employed. It is gross pay including overtime. The data are for people who work here, they do not necessarily reside here. The data is from the ONS.
