Yesterday I wrote on deaths from Covid-19 in Ludlow and across Shropshire and Telford and Wrekin. This article looks at how many people have tested positive for Covid-19 locally, in the region and across England.
The good news, and there has been little of that during this epidemic, is that there have been no Covid-19 in Ludlow for nine weeks. Previously, 31 people had tested positive for Covid-19. Sadly, eight died. We do not know whether Covid-19 was the cause of death, a contributory factor, or made no difference to a person’s survival.
This epidemic is not over. Yesterday, Shropshire Council confirmed 21 cases of Covid-19 within a traveller community on the edge of Craven Arms. More cases are expected but there is no indication that Covid-19 has spread beyond the caravan park. A testing centre has been set up in the town for anyone with symptoms.
We need to be confident when out and about but we also need to continue to take care.
First, let’s look at the trajectory of cases. The following four graphs show the weekly number of positive Covid-19 tests from 2 March to 19 July. Caveats apply to this data. It shows the numbers of people who have tested positive. It is likely that the number of actual Covid-19 cases is understated, especially in the earliest weeks when tests were difficult to obtain. That explains the steep rise in case in Weeks 13 and 14 (23 March to 5 April). Not everyone with Covid-19 will have been tested especially if they showed only mild symptoms.
The graphs above show a lag effect. Across England, identified Covid-19 cases begin in Week 10. It’s Week 11 in the West Midlands and Week 13 in Shropshire and Telford & Wrekin. In Ludlow, there have been no positive tests since Week 21 (18 May). That’s good news. (There were also no Covid-19 related deaths in Ludlow in June.)
There was a small uptick in Shropshire and the West Midlands in the first half of July. The next data release will show Shropshire cases increasing due to the ongoing Craven Arms outbreak.
Where in the county are these cases occurring?
The spatial unit for analysing local Covid-19 statistics is the Middle Super Output Area (MSOA to its friends). MSOAs are often awkward shaped areas. There 62 in Shropshire and Telford and Wrekin, each covering an average population of 8,000.
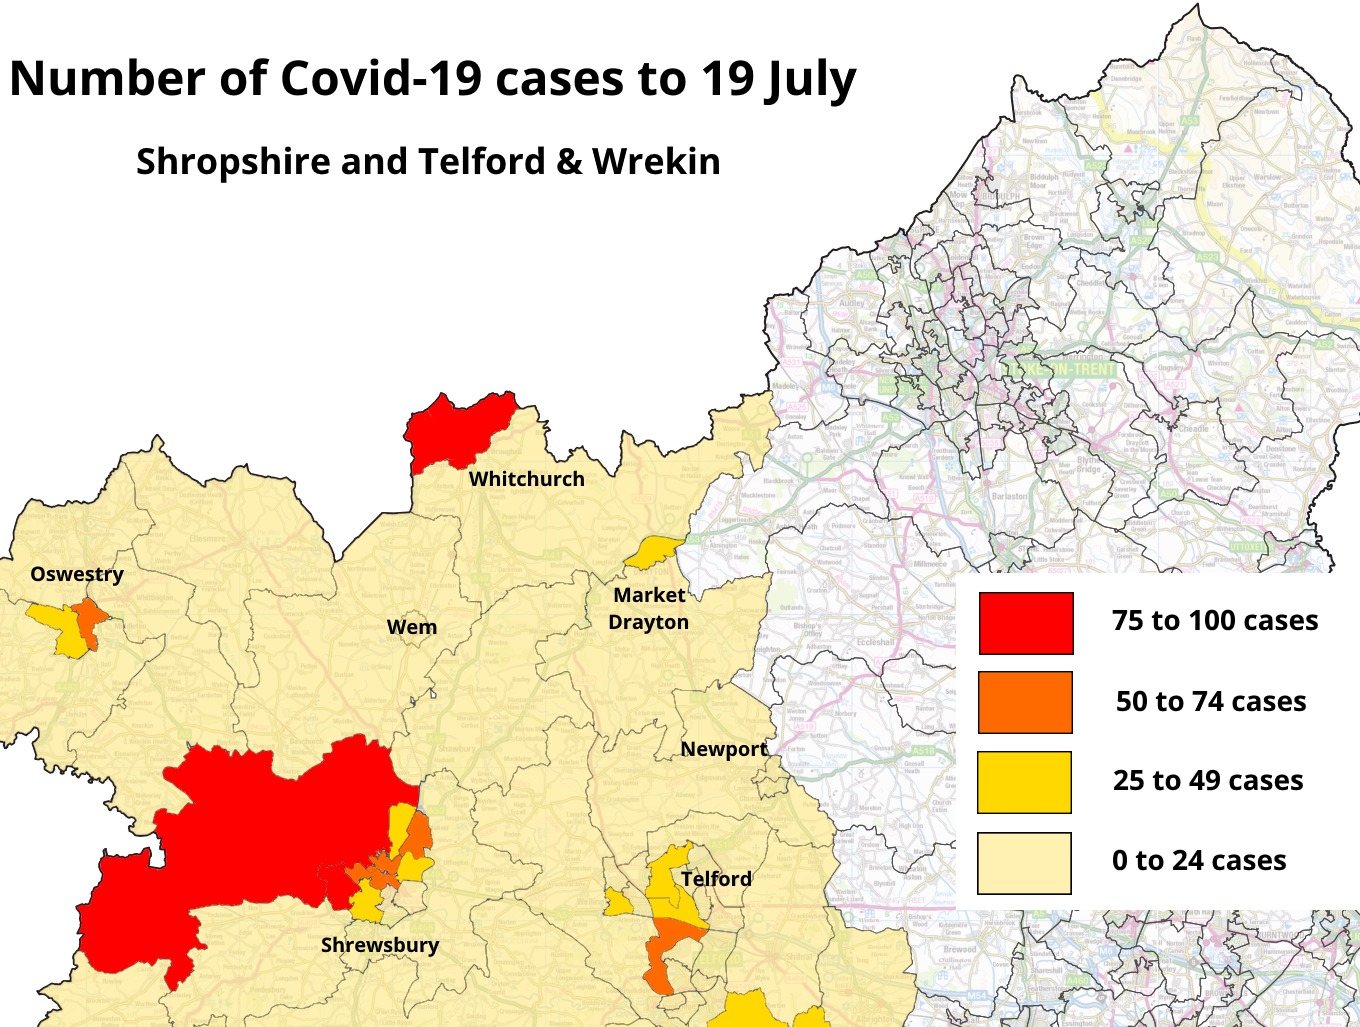
This the map of positive tests for MSOAs in Shropshire and Telford and Wrekin. It shows the highest number of cases in Shrewsbury, Telford, Whitchurch and Oswestry.
The Shrewsbury hotspot appears related to the Royal Shrewsbury Hospital. The red area on the map above spreads well out into the countryside to Westbury and Nesscliffe. This is because of the large area covered by the Bomere Heath & Montford Bridge MSOA. Adjacent is the Shrewsbury Copthorne & Bowbrook MSOA, which includes the hospital site. The two MSOAs together have seen 179 positive tests and 19 deaths. This will be residents, including hospital staff, rather than patients as cases and deaths are recorded by home address, not place of testing or death.
Notes
The data used in this article are from Public Health England.
The House of Commons Library has published a map of MSOA names.


That is a high death rate! 25+% Few cases but a significant proportion of deaths. This is very sad but I suppose expected given the demographic?
The 25% may partially be a product of low testing levels early on. It’s hard to say.