
In the last days of 2021, infection rates soared nationally and locally. The cause was the new Omicron variant first reported in November. Omicron seems to be milder, especially among those who have been vaccinated. Omicron was estimated to have been responsible for four in five cases across England and in Shropshire in the week to Boxing Day and for two-thirds of the cases in Telford & Wrekin.
In the last few days cases have continued to surge. Infection rates are the highest we have seen during the pandemic. Fourteen in 100 people in Shropshire have tested positive in the last week. That is not a cause for panic but it is a reason for caution.
There are 22 patients in the Royal Shrewsbury and Princes Royal Hospitals with Covid, a fifth of the number a year ago, reflecting the high level of vaccination and the lower health impacts of Omicron compared to earlier variants.
Cases
Despite the high level of vaccination locally, cases have been soaring in Shropshire and Telford & Wrekin, and across the country. That doesn’t mean that vaccines are ineffective. They are usually far better at reducing the severity of diseases than they are preventing people catching diseases. I will write more on this in the morning when I look at vaccination rates, as well as options for testing and catching up with jabs. More detailed hospitalisation data is also due tomorrow.
Infection rates have peaked in London and are falling. Locally, peak rates may have occurred in the last few days but the usual uncertainty in the data, combined with the New Year and a possible surge in back to school and work tests, means it will be a few days before we can see the underlying trend.


Variants
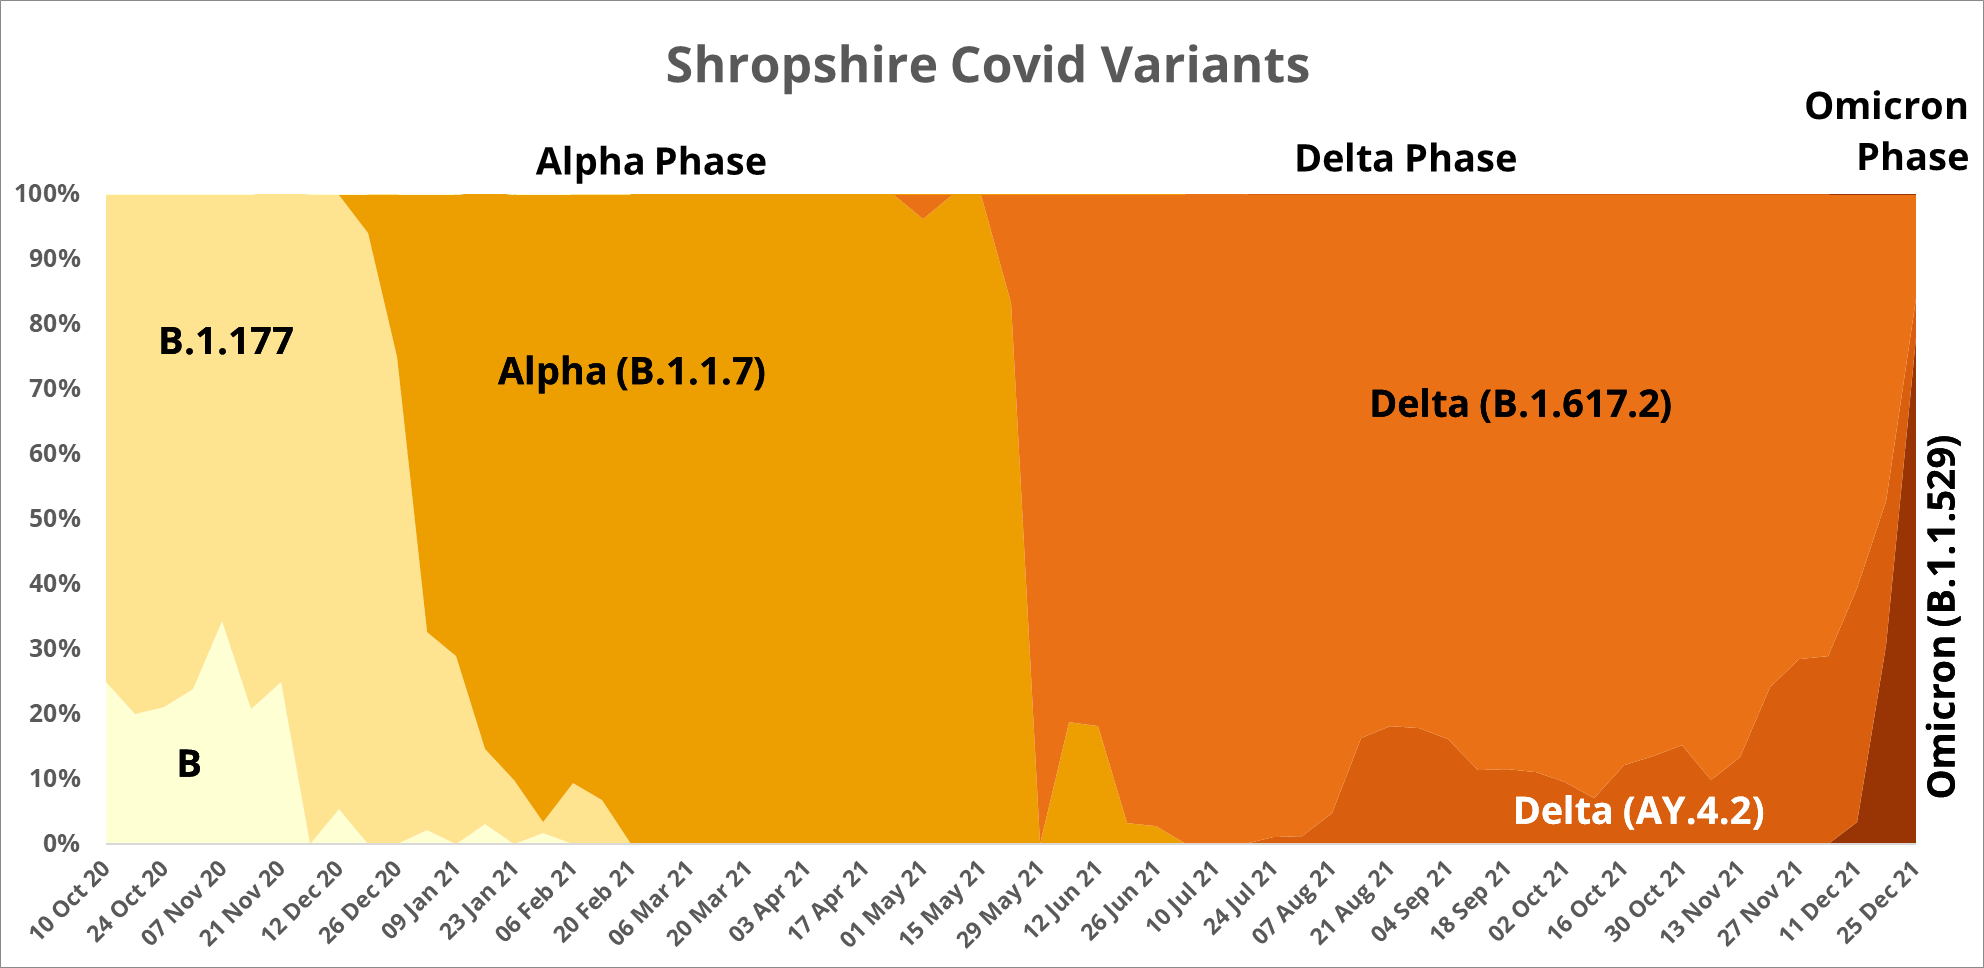
Like all viruses, Covid-19 is constantly mutating and around 500 variants and subvariants have been detected in England. But only a handful of these have been designated Variants of Concern (VOC) by the World Health Organisation (WHO). The variants have scientific nomenclatures but to reduce confusion and promote public discussion, from last May the WHO has labelled all VOC with Greek letters. Thus variant B.1.1.529, now the dominant variant in the UK, is known to all as Omicron. It almost sounds friendly.
Some mutations are more dangerous and cause more severe illness greater levels hospitalisation. Others are more transmissible and spread at lightening speed.
As the vaccination campaign got underway early in 2021, Alpha became the dominant variant. Early in the summer, Delta quickly took prominence and remained in that position until mid-December. At that point, Omicron became the dominant variant within just a few weeks.


Notes
Variants. Data used on variants is from the Sanger Institute.
Sequencing. In the seven days to 12 December, more than three million PCR tests were conducted in England and more than one in ten gave positive results. Four laboratories in England sequenced 15 per cent of the positive tests that week. The level of sequencing seems to vary widely, especially at a local level. For example, 347 tests from Shropshire were sequenced in the week to 27 November, the highest weekly total to date. That was 20 per cent of the 1,740 positive tests in Shropshire. In the week to 25 December as cases soared across the country, just five per cent of 2,557 positive tests in Shropshire were sequenced.
Confidence. Because only a sample of PCR tests are sequenced, there is a level of uncertainly in the headline statistics. In the week to 25 December the Sanger Institute’s estimate was that 80.8% of Covid-19 cases in England were caused by the Omicron variant. It said it had 95% confidence that the actual level of Omicron infection was between 78.8% and 80.8%, a very narrow range. In Shropshire, the estimate of Omicron prevalence was 78.0% but because fewer samples were sequenced there is a wider 95% confidence interval of 70.2% to 84.2%.
Daily Covid case rates. We have got used to hearing about the number of new positive cases on the evening news programmes. This is a bit misleading. The daily data issued daily is the number of cases reported that day, not the number people who tested positive that day. The number of reported cases tends to dip during weekends and public holidays and shoot up afterwards. The reported cases are redistributed to date of test over a period of a few days. In the graphs on this blog, I use a seven day moving average to calculate infection rates, smoothing out the daily fluctuations from reporting and testing.